




▲ 11.2% month over month
Overall critical freight activity accelerated in October, rising 11.2% from September.
▲ 1.9% month over month
Airport-related freight was relatively stable in October, increasing 1.9%.
▲ 13.5% month over month
Life sciences freight activity increased 13.5% in October, continuing September’s growth.
▲ 19% month over month
Latest available Massport data is September 2026. Boston Logan cargo weight increased 19.0% from August.
Overall critical freight activity increased 11.2% from September to October, resulting in a Overall Index score of +1.0. This marks the second consecutive month of growth following August’s decline.
Airport-related freight increased 1.9% month over month, producing an Airport Freight Index score of 0. Airport-related freight represented 22.8% of October activity.
Life sciences freight increased 13.5% month over month, outpacing overall critical freight growth. The Life Sciences Index reached +1.0, with the category representing 19.2% of October activity.
Boston Logan benchmark:
The latest available Massachusetts Port Authority cargo data is September 2026. Boston Logan cargo weight increased 19.0% from August, producing a momentum score of +1.5.
The momentum score translates month-over-month movement into a standardized scale. Positive scores indicate increasing activity, negative scores indicate decreasing activity and zero represents relatively stable month-over-month movement.
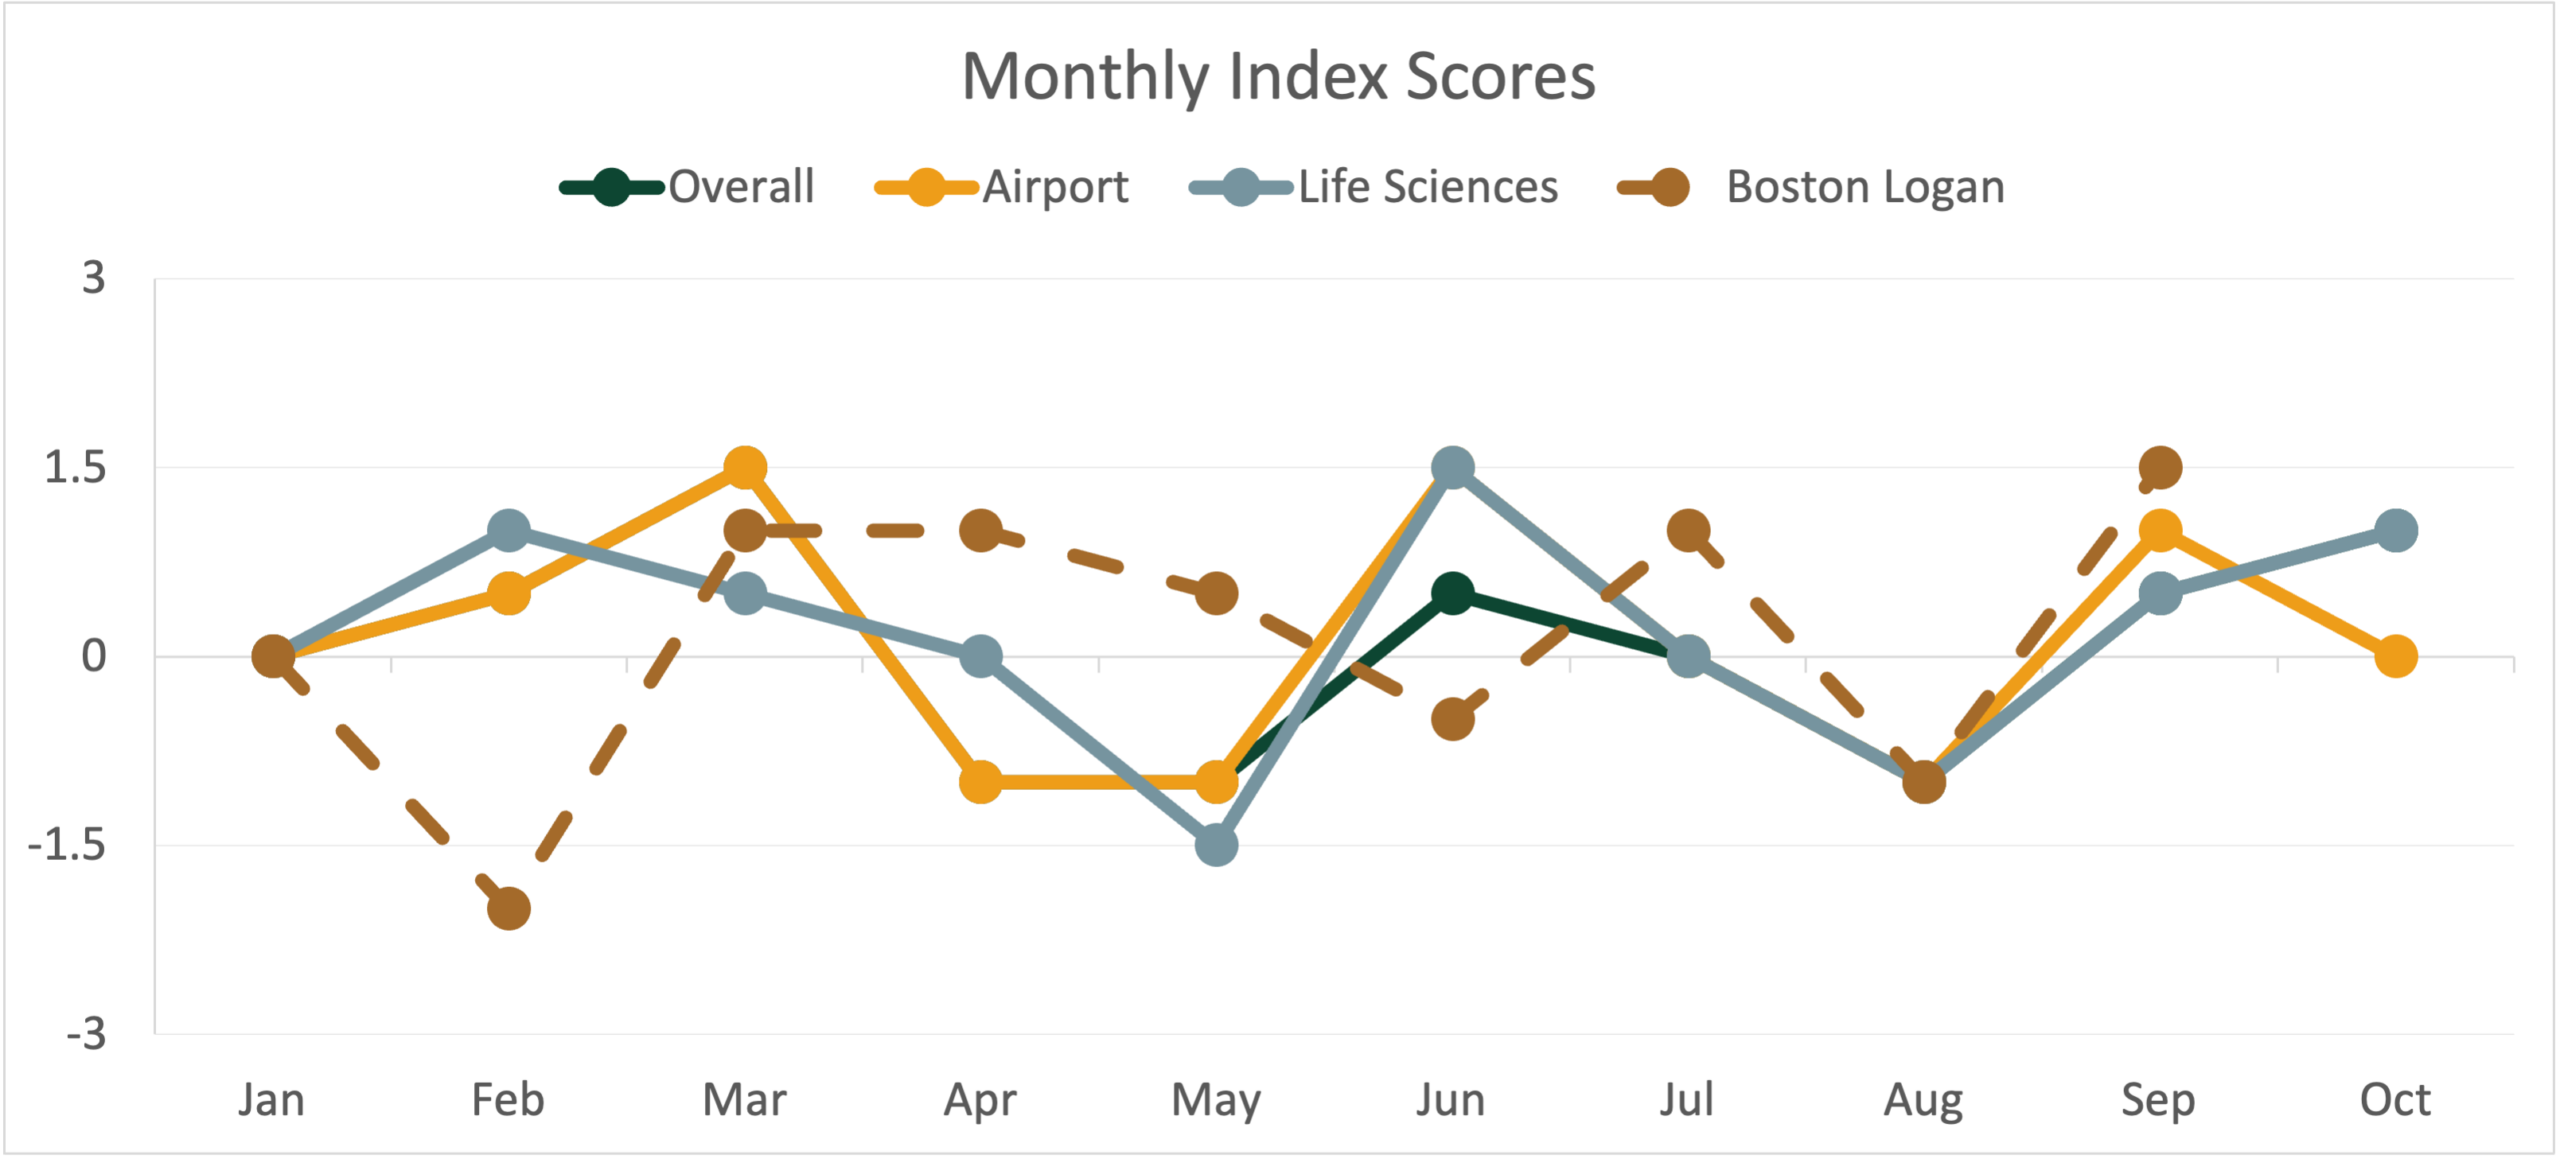
Boston Logan cargo activity is shown through September 2026, the latest available Massachusetts Port Authority reporting period.
28Freight indicators are based on completed shipment activity. Boston Logan cargo data is reported by Massport by weight and serves as an external directional benchmark.
| Month | Overall Change | Airport Change | Life Sciences Change | Boston Logan Change | Overall Index | Airport Index | Life Sciences Index | Boston Logan Index |
|---|---|---|---|---|---|---|---|---|
| Jan 2026 | — | — | — | — | 0 | 0 | 0 | 0 |
| Feb 2026 | +7.9% | +5.3% | +12.1% | −18.6% | +0.5 | +0.5 | +1.0 | −2.0 |
| Mar 2026 | +17.3% | +16.4% | +5.4% | +10.4% | +1.5 | +1.5 | +0.5 | +1.0 |
| Apr 2026 | −5.1% | −5.4% | +1.1% | +10.3% | −1.0 | −1.0 | 0 | +1.0 |
| May 2026 | −6.0% | −6.8% | −13.2% | +9.4% | −1.0 | −1.0 | −1.5 | +0.5 |
| Jun 2026 | +9.9% | +18.8% | +18.6% | −2.0% | +0.5 | +1.5 | +1.5 | −0.5 |
| Jul 2026 | +1.7% | +3.9% | +1.8% | +10.6% | 0 | 0 | 0 | +1.0 |
| Aug 2026 | −5.7% | −8.6% | −5.1% | −7.1% | −1.0 | −1.0 | −1.0 | −1.0 |
| Sep 2026 | +5.8% | +11.3% | +5.6% | +19.0% | +0.5 | +1.0 | +0.5 | +1.5 |
| Oct 2026 | +11.2% | +1.9% | +13.5% | — | +1.0 | 0 | +1.0 | — |
The New England Critical Freight Index is calculated from proprietary shipment activity within 28Freight’s transportation management system (TMS). Shipments are assigned to each reporting month based on proof-of-delivery date. Raw shipment volumes are normalized into month-over-month percentage changes and standardized index scores, allowing directional trend analysis while protecting proprietary operational data.
Historical Airport Freight and Life Sciences figures have been updated to reflect expanded customer and location classifications. Historical values may therefore differ from previously published figures.
Source: 28Freight’s transportation management system shipment data, January 1–October 31, 2026, and Massachusetts Port Authority Boston Logan International Airport cargo statistics through September 2026. The index reflects 28Freight’s proprietary shipment activity and is intended to show directional movement over time, not the entire freight market. Raw 28Freight shipment counts are not published.